Выбор данных
Я решил анализировать данные о запрещенных играх, потому что я начинающий разработчик игр и мне интересно создавать проекты на спорные темы, такие как религия. Мне интересно, в каких странах это может стать проблемой, и как часто игры запрещают в целом.
Я нашел датасет на data.world, мне показалось, что он достаточно информативный для моих целей.
Для получения выводов, полезных мне, мне понадобились только простые виды графиков: круговой и два вида столбчатых.
Создание графиков
Графики сделаны в Google Colab с помощью встроенной в него LLM Gemini. В части с итоговыми графиками прикреплен промпт для gemini и код после каждого графика.
Стилизация
Цветовая палитра подобрана с помощью сайта coolors.co, графики обработаны через сайт designcap.com. Некоторые части графиков исключены за ненадобностью.
Графики
from matplotlib import pyplot as plt import seaborn as sns import pandas as pd df = pd.read_csv ('https://raw.githubusercontent.com/vaguelyhuman0id/Ban/main/Games.csv')
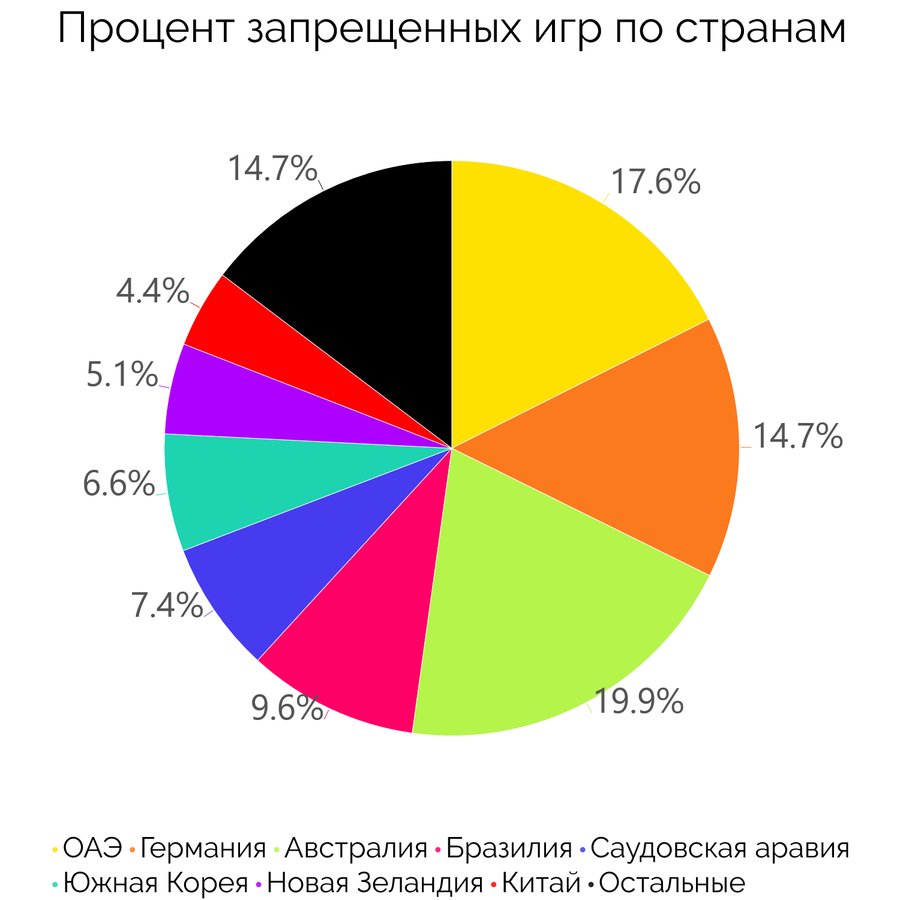
prompt: make a pie chart with countries from the imported data, group all countries that have less than 4% into 'other' category
countries = df['Country'].value_counts () other_countries = countries[countries < 4].sum () countries['Other'] = other_countries countries = countries.drop (countries[countries < 4].index)
plt.figure (figsize=(15, 8)) plt.pie (countries, labels=countries.index, autopct='%1.1f%%', startangle=90) plt.title ('Countries with Most Games on Steam') plt.show ()
prompt: split ban category by '|' and and make a pie chart of the countries that banned games for ideological and/or religious reasons
df['Ban Category'] = df['Ban Category'].fillna ('') ideological_religious_bans = df[df['Ban Category'].str.contains ('Religious')] ideological_religious_bans_countries = ideological_religious_bans['Country'].value_counts ()
plt.figure (figsize=(15, 8)) plt.pie (ideological_religious_bans_countries, labels=ideological_religious_bans_countries.index, autopct='%1.1f%%', startangle=90) plt.title ('Countries that Banned Games for Ideological and/or Religious Reasons') plt.show ()
prompt: split the ban categories by '|', and make a bar plot chart of the number of games in each category, and write the value on each bar
plt.figure (figsize=(15, 8)) sns.barplot (x=ban_categories.index, y=ban_categories.values)
for i, value in enumerate (ban_categories.values): plt.text (i, value, str (value), ha='center', va='bottom')
plt.xlabel ('Ban Category') plt.ylabel ('Number of Games') plt.title ('Number of Games in Each Ban Category') plt.xticks (rotation=45) plt.show ()
prompt: split ban category by '|' and make a stacked bar chart with the top 5 countries, in which the bar is the number of banned games and the precentage of the bar is top 5 ban reasons
ban_category_split = df['Ban Category'].str.split ('|').explode () top_5_countries = df['Country'].value_counts ().head (5).index top_5_ban_reasons = ban_category_split.value_counts ().head (5).index
ban_reasons_by_country = ( df[df['Country'].isin (top_5_countries)] .groupby (['Country', 'Ban Category']) .size () .unstack (fill_value=0) .loc[top_5_countries, top_5_ban_reasons] )
ax = ban_reasons_by_country.plot (kind='bar', stacked=True, figsize=(15, 8))
for i in ax.patches: ax.annotate (str (i.get_height ()), (i.get_x () + i.get_width () / 2., i.get_height ()), ha='center', va='bottom')
plt.title ('Top 5 Countries with Banned Games by Ban Reason') plt.xlabel ('Country') plt.ylabel ('Number of Banned Games') plt.xticks (rotation=45) plt.show ()
prompt: make a stacked bar chart with the top 5 countries by number of banned games, in which the bar is the number of banned games and the precentage of the bar is the ban status
import matplotlib.pyplot as plt ban_status = df['Ban Status'].value_counts () top_5_countries = df['Country'].value_counts ().head (5).index
ban_status_by_country = ( df[df['Country'].isin (top_5_countries)] .groupby (['Country', 'Ban Status']) .size () .unstack (fill_value=0) .loc[top_5_countries, ban_status.index] )
ax = ban_status_by_country.plot (kind='bar', stacked=True, figsize=(15, 8))
for i in ax.patches: ax.annotate (str (i.get_height ()), (i.get_x () + i.get_width () / 2., i.get_height ()), ha='center', va='bottom')
plt.title ('Top 5 Countries with Banned Games by Ban Status') plt.xlabel ('Country') plt.ylabel ('Number of Banned Games') plt.xticks (rotation=45) plt.show ()
Ссылка на датасет и код: drive.google.com/drive/folders/1rCLPB9ghnMsQN_RwMeX–VBOhNn1vZFBk? usp=sharing